

Research Article
Received: 2025-04-02 | Revised:2025-08-14 | Accepted: 2025-10-30 | Published: 2026-03-15
Pages: 15-22
DOI: https://doi.org/10.58985/jesec.2026.v03i01.17
Abstract
In the municipality of Cherif Lo,
the spatiotemporal evolution of phosphate quarries has resulted in mutations in
land use. This spatial growth is one of the factors in the dynamics of the
landscapes, leading to enormous environmental consequences in the study area.
The present study aimed to analyze the spatial changes around phosphate
quarries from 1973 to 2024. Using a remote sensing mapping approach coupled
with tools for collecting and processing field maintenance data, the
evolutionary trends in land use were quantified in the study area. The spread
of phosphate quarries in the Senegalese Company of Phosphates of Thies (SSPT) and Senegalese Phosphate Company (SEPHOS) is 796.87% and 0.18%,
respectively, between 1973 and 2024. This area also recorded a
rapid expansion of buildings (1825.08%), and orchards (1191.03%) over the study period followed by a
regression of other crop areas (-58.06%) and vegetation (-12.20%). These
negative effects are much more pronounced near mining sites. These
disturbances, linked to the evolution of phosphate quarries, were amplified
over time and were perceptible within all classes of distance from mining
sites.
Keywords
Spatiotemporal dynamics, phosphate quarries, environmental consequences, Senegal.
1. Introduction
Since 1960, the Thies region has been known for its activity that has
specialized in the extraction and enrichment of phosphate for certain economic
profits. The exploitation of these phosphates is carried out in the northwest of
Thies and straddles
the former groundnut basin of Senegal and the Niayes area, a
geographical region with significant agricultural potential. It began in the
second half of the 1950s, first by the Senegalese Phosphate Company of Taiba
(CSPT) and then from the 1990s, by the Chemical Industries of Senegal (ICS) [1].
Historically, its first steps date back to the 1940s and 1950s with the
entry into production of the Taïba and Lam-Lam mines in the Thies region.
For a long time, mining in Senegal was limited to the latter. With deposits
scattered throughout almost the entire territory (Thies, Louga, Diourbel,
Fatick, Kaolack, Tambacounda, Kolda, Kedougou, etc.), Senegal has world-class
phosphate reserves, estimated at more than one billion tons. This is equivalent
to 500 years of exploitation at an annual production of 2 million tons. During
their extraction and reclamation, the host municipalities undergo spatial
changes, landscape modification degradation of vegetation cover, and reduction
in agricultural land. The of this study was to map the spatiotemporal changes
induced by phosphate mining and its environmental consequences. The main
results provide cartographic statistics for a better understanding of the
dynamics of land use in the commune of Chérif Lo from 1973 to 2024.
The Thies region is one of the regions of Senegal renowned for its wealth in phosphate mining. Among these phosphate mining areas, the Lam-Lam perimeter located in the municipality of Cherif Lo. This area, which is the focus of this study, has long been included in the mapping of the location of the country's mining sites. This commune is located in the central-western part of the former groundnut basin of Senegal. It is part of the district of Pambal, the department of Tivaouane and the region of Thies, 14 km to the northeast; and 84 km from the capital Dakar. Chérif Lô includes 42 villages and covers an area of 122 km sq out of a population of about 23310 inhabitants. It is bounded: to the north by the communes of Pire Goureye and Tivaouane; to the south by the communes of Fandene and Thiénaba; to the west by the communes of Mont-Rolland and Thiés Nord; to the east by the commune of Touba Toul (Map 1).

Map 1. Location of the study area.
2. Materials
and methods
2.1. Materials
In this study, three satellite images from the Landsat series (Multi Spectral Sensor –MSS-, Thematic Mapper -TM, Operational Land Imager -OLI- and the Thermal Infrared Sensor –TIRS-) were used to map the land cover dynamics of the study area [2] (Table 1, Map 2).
Table 1. Map data used.
|
Satellite
and sensor |
Dates of acquisition |
Spatial resolution |
Number of scene |
|
Landsat 1 MSS |
1973 - 04 - 16 |
60 m |
Scene 1 220/049 |
|
Landsat 5 TM |
1985 - 05 – 09 |
30 m
|
Scene 1 205/050 |
|
Landsat 8 OLI -TIRS |
2024 - 05– 23 |
Scene 1 205/049 |

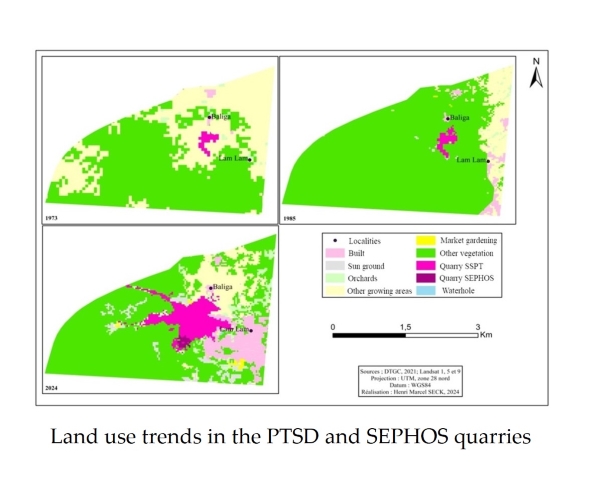
Map 2. Land use trends in the PTSD and
SEPHOS quarries.
2.2.
Satellite data processing
The production of land cover maps from satellite images of different dates are mainly based on the processing methods. The latter first required geometric correction so that the three images (1973, 1985 and 2024) had the same characteristics (spatial resolution of the images retained, the combination of bands to make colored compositions and the identification of thematic classes). Then the false color composition and finally the supervised classification. In order to better understand the dynamics of land use in the study area, we conducted GPS surveys on the classes, particularly those selected. These surveys allowed us to accurately locate the classified sites and validate the land use maps.
The images acquired by various Earth observation systems are often not directly superimposed on the map [3]. They contain geometric formations due to system errors, the positioning of the satellite in its orbit or the Earth's relief and the environment observed. Geometric correction makes it possible to restore the distorted image to a plane comparable to that of a map in the case of distortion or to another image in the case of a superposition of images acquired with different sensors [4, 5]. All images used for mapping of the land use of the municipality of Cherif Lo were geometrically corrected. The 2024 Landsat image, acquired with the OLI-TIRS sensor and having a more correct geometry, was used as a reference to correct the other Landsat images available with the image transformation method using mathematical models based on the precise recognition of parameters related to data intake (Table 2). This pre-processing made it possible to superimpose different images for mapping of land cover dynamics. Envi Classic processing software was used to perform the geometric correction.
Table 2. Some characteristics of the landsat sensors used.
|
Sensor and platform |
MSS Landsat 1 |
TM Landsat 5 |
OLI –TIRS Landsat8 |
|
|
Spectral
Bands in (μm) |
Aerosols |
--- |
--- |
0,433 -
0,453 |
|
Blue |
|
0,45 –
0,52 |
0,450 -
0,515 |
|
|
Green |
0,5 –
0,6 |
0.52 -
0.60 |
0,525 -
0,600 |
|
|
Red |
0,6 -
0,7 |
0,63 –
0,69 |
0,630 -
0,680 |
|
|
Near
Infrared |
0,7 -
0,8 0,8 - 1,1 |
0,76 –
0,90 |
0,845 -
0,885 |
|
|
Mid-infrared |
--- |
1,55 –
1,75 2,08 – 2,35 |
1,560 -
1,660 2,100 -
2,300 |
|
|
Thermal
Infrared |
--- |
10,4 –
12,50 |
10,30 -
11,30 11,50 -
12,50 |
|
|
Panchromatic |
--- |
--- |
0,500 -
0,680 |
|
|
Cirrus |
--- |
--- |
1,360 -
1,390 |
|
|
Spatial
resolution |
General:
79 m |
General: 30 m Thermal infrared: 120 m |
General: 30 m Panchromatic: 15m Thermal infrared: 60 m |
|
2.4. Color composites
A color composite is a technique that
allows the production of color images considering the spectral signature of
objects. In this study, we used the so-called false-color infrared color
composition for processing these different satellite images (1973, 1985 and 2024).
The choice of this color composition is linked to the fact that plants have a
significant peak in the near-infrared (high reflectance) and an absorption band
in the red region. This is very effective for vegetation analysis (Canada
Centre for Remote Sensing, 2008). We obtained them by combining the spectral
bands 7-5-4, for the MSS 1973 image, the 4-3-2 bands for the 1985 MSS image and
finally the 5-4-3 bands for the 2024 OLI_TIRS image.
2.5. The choice of
thematic classes and classification
For the identification of the land
cover classes, we based ourselves on the characteristics of the image (colour,
shape, hue and texture of the objects). Initially, these areas included nine
(9) occupancy classes that were eventually grouped together for the purposes of
the study. Thus, seven (7) land use classes were retained: buildings, bare land
(undeveloped land without vegetation), vegetation, rainfed cropping area,
market gardening area, waterhole and quarries. Supervised classification was based
on these classes.
In other words, it involves grouping the pixels of an image according to a
predefined number of classes. This method requires knowledge of the study areas.
Thus, we used regions of interest (ROI) that served as a basis for the
calculations of classification algorithms according to the maximum likelihood
(100 times the number of bands). However, this method (maximum likelihood),
considered to be the most widely used according to [3],
requires us to choose at least 300 spectrally representative pixels for each
identified spectral signature, considering the number of bands we used (3
bands). To assess the quality of the classifications, we conducted a spectral
separability analysis of the different land use classes by selecting the
Jeffries separability index Matusita. The result showed that the separability
value was between 1.9 and 2 for the retained classes, which indicated a good
quality of separability of the retained thematic classes. This allowed us to determine
the accuracy of the ROIs and their representativity on the image.
Two indices of the confusion
matrices allowed us to evaluate the quality of the classification: an overall
accuracy index and a Kappa index. The first is expressed as a percentage and
provides information on the overall quality of the classification, and the
second is calculated for all classes, also provides information on the overall
quality of the classification. Its calculation considered that some pixels can
randomly be classified. This index varies between -∞ and 1. The closer the
kappa is to 1, the better is the classification.
Thus, at the end of the supervised classification the confusion matrix yielded overall precision values of 96.22% and 98.29% and Kappa coefficients from 0.96% to 0.98% (Table 3). The results of these indices showed that the discrimination between land cover classes was statistically acceptable.
Table 3. Summary of accuracy
reliability indices.
|
Index |
1973 |
1985 |
2024 |
|
Overall accuracy (%) |
96,22 |
98,21 |
98,29 |
|
Coefficient de Kappa |
0,96 |
0,98 |
0,98 |
2.6. Equipment used
For this study, we used ENVI Classic version 5.6 and ArcMap 10.8. The Envi Classic 5.6 tool enabled the analysis and processing of the satellite images. ArcMap 10.8, was used to determine the surface area of each of the selected land cover classes to proceed with the layout of the maps (Table 4).
Table 4. Equipment used.
|
Software
Name |
Usefulness |
|
Envi Classic 5.6 |
Satellite image processing |
|
Arc Map 10.8 |
Map layout |
|
Word |
Writing the manuscript |
2.7. Land use mapping
Digitization consists of representing the different elements of land use from the different geometrically corrected raster data in the form of polygons, lines and points. The study of the landscape dynamics of the study area was carried out on ArcMap 10.8 by cross-referencing the different land cover layers (1973, 1985 and 2024). The statistics of the spatiotemporal evolution of land cover in the surroundings of the SEPHOS quarry and PTSD were calculated using the formulas.

3. Results
3.1. Spatio-temporal dynamics of landscapes in the vicinity of the PTSD phosphate quarry and SEPHOS between 1973 and 2024
3.1.1. Land use of the study area in 1973
Remote sensing mapping, based on the 1973 Landsat satellite image, has made it possible to discriminate and describe the different land cover units in the vicinity of the PTSD quarry and SEPHOS (Table 5).
Table 5. Land cover unit statistics in the vicinity of PTSD and SEPHOS in 1973.
Land cover units | Surfaces | |
In ha | In % | |
Other vegetation | 698,90 | 68,93 |
Orchards | 3,68 | 0,36 |
Bare floors | 1,80 | 0,18 |
Other crop area | 292,97 | 28,89 |
Built | 5,78 | 0,57 |
Quarry SSPT | 10,87 | 1,07 |
Total | 1013,99 | 100 |
The total mapped area was estimated to be 1013.99 ha; and the occupancy classes were dominated by vegetation. The latter covered 698.90 ha, or 68.93% of the study area. It was followed by cultivation areas which occupied 292.97 ha corresponding to 28.89% of the mapped area. Buildings, orchards and bare land were poorly represented. In total, these land covered layers and had an area of 11.26 ha, which 0.36% was covered by orchards, 0.18% by bare soil and 0.57% by buildings. As for the phosphate quarries of the PTSD and SEPHOS, they covered only 1.07% of the total area i.e. 10.87 ha.
3.1.2. Land use in the study area in 1985
In 1985, the vegetation was dominant in the study area. With an occupancy rate of 85.69% of the area considered, the other vegetation class was dominant in terms of area. The other crop areas class was recorded 8.73% of the studied area. The houses, located in the eastern part of the quarries, covered about 24.90 ha, or 2.46%. The remaining space was divided between orchards (0.56%), bare soil (0.28%) and quarries (2.20%). The latter category was poorly represented in 1973, that increased in 1985 at 11.47 ha (Table 6).
Table 6. Land cover unit statistics in the vicinity of SPT and SEPHOS in 1985.
Land cover units | Surfaces | |
In ha | In % | |
Other vegetation | 868,84 | 85,69 |
Orchards | 5,71 | 0,56 |
Bare floors | 2,87 | 0,28 |
Other growing areas | 88,55 | 8,73 |
Built | 24,90 | 2,46 |
Quarry SSPT | 22,34 | 2,20 |
Market gardening area | 0,25 | 0,02 |
Waterhole | 0,53 | 0,05 |
Total | 1013,99 | 100 |
3.1.3. Land use of the study area in 2024
The analysis of the temporal variation in land cover was also based on the map statistics of the 2024 Landsat image. Through these statistics, we have shown the most extensive classes in the mapped space. The classes with the highest proportions were other vegetation (60.52%), other growing areas (11.66%), buildings (10.97%) and quarries (9.61%), whereas the classes with the lowest proportions were orchards (4.69%) and bare floors (2.09%) (Table 7). The latter classes represented less than 10% of the total studied area.
Table 7. Land cover unit statistics in 2024.
Land cover units | Surfaces | |
In ha | In % | |
Other vegetation | 613,63 | 60,52 |
Orchards | 47,51 | 4,69 |
Bare floors | 21,23 | 2,09 |
Other growing areas | 118,21 | 11,66 |
Built | 111,27 | 10,97 |
Quarry SSPT | 97,49 | 9,61 |
Quarry SEPHOS | 1,79 | 0,18 |
Market gardening area | 0,98 | 0,10 |
Waterhole | 1,89 | 0,19 |
Total | 1013,99 | 100 |
The analysis of cartographic statistics shown in Table 7 which the period 1973-2024 is characterized by a strong evolution of land cover classes. The built environment increased from 5.78 ha in 1973 to 111.27 ha in 2024 with the largest increase estimated at around 1825.08% (Table 8). In the municipality of Chérif Lô, rapid population growth (17,162 in 2005; 22117 in 2024 and 23310 in 2023) was contributed to the evolution of land use, particularly around phosphate quarries, where dust raised enormously, which is environmental and health consequences.
Table 8. Land use statistics surrounding the PTSS and SEPHOS quarry in 1973, 1985 and 2024.
Land cover units | Surfaces |
| Rate of change | |||||
1973 | 1985 | 2024 | 1973-2024 | |||||
ha | % | ha | % | ha | % |
|
| |
Other vegetation | 698,90 | 68,93 | 868,84 | 85,69 | 613,63 | 60,52 |
| -12,20 |
Orchards | 3,68 | 0,36 | 5,71 | 0,56 | 47,51 | 4,69 | 1191,03 | |
Bare floors | 1,80 | 0,18 | 2,87 | 0,28 | 21,23 | 2,09 | 1079,44 | |
Other growing areas | 292,97 | 28,89 | 88,55 | 8,73 | 118,21 | 11,66 | -58,06 | |
Built | 5,78 | 0,57 | 24,90 | 2,46 | 111,27 | 10,97 | 1825,08 | |
Quarry SSPT | 10,87 | 1,07 | 22,34 | 2,20 | 97,49 | 9,61 | 796,87 | |
Quarry SEPHOS | --- | --- | --- | --- | 1,79 | 0,18 | --- | |
Market gardening area | --- | --- | 0,25 | 0,02 | 0,98 | 0,10 | 292 | |
Waterhole | --- | --- | 0,53 | 0,05 | 1,89 | 0,19 | 256,60 | |
Total | 1013,99 | 100 | 1013,99 | 100 | 1013,99 | 100 | --- | |
3.1.4. Summary of land use dynamics from 1973 to 2024
The area covered by orchards was the second largest after buildings. Its occupation in the area increased from 3.68 ha in 1973 to 47.51 ha in 2024, i.e. was an increase of 1191.03%. The spatial and temporal dynamics of the landscapes also shown a regression of two land cover units that were noticeable in Map 2. These are the vegetation cover and cultivation areas in the vicinity of the phosphate mining sites of PTSD and SEPHOS. The vegetation cover recorded an area from 698.90 ha in 1973 to 613.63 ha in 2024, which was a regression of 12.20%. The cultivation area decreased from 292.9 to 12.12 ha, i.e. a loss of area of 58.06%. These two classes of land use have experienced regressions due to the sprawl of phosphate quarries and the migratory flows of local populations to the mining perimeter. This situation led to accelerated deforestation and loss of croplands [6]. This same situation was also noted in our study area, where phosphate quarries have undergone changes in agricultural lands and plant formations. Therefore, the degradation of environmental conditions has become the main source of conflict, affecting the relationship between local communities and the extractive industries (PTSD and SEPHOS) in the studied area.
Human activities have repercussions on a global scale. Most of them intensify permanently, forming an extremely complex system of relationships involving land use (bare soil, water, vegetation, cropland, etc.). The acceleration of the world’s population growth rate since the 1970s has led to relentless search for new approaches to manage the Earth's resources. Approximately 4 centuries ago, 66% of the land was covered by forests, compared to only 30% today, which represents about 4.06 billion hectares (including 1.11 billion hectares of primary forests), according to the 2020 report of the Food and Agriculture Organisation (FAO). As per World Resources Institute (WRI, 2020), 80% of the world's original forests have been cut down or degraded, mainly in the last 30 years. Inappropriate land use often results in soil degradation and low soil fertility. In addition, inappropriate use manifested by the modification of the spatial structure of the landscape, leading to fragmentation of forest cover, which observed very harmful effects on the organization of ecosystems [7]. Thus, in the study area, mapping and analysis of occupancy dynamics were performed using Landsat imagery and supervised classification [8]. In the commune of Chérif Lô, phosphate mining has changed the landscape. This resulted in a spatiotemporal expansion of the quarries in the study area. During the study period, the land use in the area around the PTSD and SEPHOS phosphate quarry underwent significant changes. Cultivated and other vegetated areas decreased by -58.06% and -12.20%, respectively, in favor of phosphate quarries (796.87%), built (1825.08%), orchards (1191.03%) and bare soils (1079.44%). The causes of these landscape changes are mainly anthropogenic. The results showed that this land use dynamic is linked to phosphate mining. Indeed, mining activities lead to an influx of population and promote the multiplication of effects complementary to those of mining itself, such as agricultural expansion and the multiplication of constructions, which contribute to deforestation and the degradation of agricultural lands [9-11]. As a result, population growth leads to the degradation of soils, vegetation and biodiversity [11-14]. As a corollary, it also generates rivalries for access to space and resources [7].
5. Conclusions
This study presents the current trends in landscape dynamics in the area around the phosphate quarries in the commune of Chérif Lô. The results show that the areas of crops and other vegetation have regressed, but also that they have undergone regression. Near these sites, the sprawl of quarries occurs in cultivated areas leading to their destruction, regression and degradation of the vegetation cover. This phenomenon was observed in the study area, and in areas that close to the mining sites. Whatever may emerge from this, continuous monitoring of landscape changes appears to be important for the implementation of environmental management programs adapted to the realities on the ground. To ensure that the highlighted changes are linked on the one hand to phosphate mining, it will be necessary to study other sectors far from the quarries. The results would allow actors, particularly the extractive industries, to measure the impacts of their operations and find the best ways to rehabilitate degraded areas. Therefore, we recommend the establishment of an observatory dedicated to this issue.
Disclaimer (artificial intelligence)
Author(s) hereby state that no generative AI tools such as Large Language Models (ChatGPT, Copilot, etc.) and text-to-image generators were utilized in the preparation or editing of this manuscript.
Authors’ contributions
Conceptualisation, H.M.S., E.B.D., T.S., B.F.; investigation, methodology, logical analyses formula, data curation, first draft preparation, project administration H.M.S.; writing—revision and editing, H.M.S., E.B.D., T.S., B.F.
Acknowledgements
The authors sincerely thank the rural dwellers who participated in the data collection. We also express our deep gratitude to the handling editor and all anonymous reviewers for their valuable contributions to the significant improvement of this manuscript.
Funding
This research received no external funding.
Availability of data and materials
The data are available from the corresponding author upon request.
Conflicts of interest
The authors declare no conflict of interest.
References
|
1. |
Diallo, M.L. The Taïba phosphate industry in Senegal:
Mining front and local tensions. Vertigo. 2017, 28.
https://doi.org/10.4000/vertigo.18330 |
|
2. |
Mbavumoja, T.; Ebuy, A.J.; Masimo, K.J. Mapping of land use
dynamics in the INERA-Yangambi concession in the Democratic Republic of
Congo. Rev. Mar. Sci. Agron. Vét. 2022, 10(1), 195-204. |
|
3. |
WRI (World Ressources Institute), 2020.
https://www.wri.org/our-work/topics/forests |
|
4. |
Andrieu, J. ; Mering, C. Cartographie par
télédétection des changements de la couverture végétale sur la bande
littorale ouest-africaine, l’exemple des Rivières du Sud: Du Delta du Saloum
(Sénégal) au Rio Geba (Guinée-Bissau). Télédétection, 2009, 8(2), 93-118.
<halshs-00388170>. |
|
5. |
Dieye, E.B. The coastal areas of the Joal-Fadiouth lagoon
and the Saloum estuary (Senegal): Methodological approach to mangrove
dynamics between 1972 and 2005 by remote sensing and geographic information
systems (GIS). Cheikh Anta
Diop, Dakar, p.266, 2007. |
|
6. |
Kamga, M.A.; Nguemhe, F.S.C.; Ayodele, M.O.; Olatubara, C.O.;
Nzali, S.; Adenikinju, A.; Khalifa, M. Evaluation of land use/land cover
changes due to gold mining activities from 1987 to 2017 using Landsat imagery,
East Cameroon. GeoJournal. 2019, 85,
1097-1114. https://doi.org/10.1007/s10708-019-10002-8 |
|
7. |
Broadbent, E.N.; Asner, G.P.; Keller,
K.D.E.; Oliveira, P.J.C.; Silva, J.N.; Bruna, E.M. Biological impacts of
deforestation and fragmentation. Encyclop. Forest Sci. 2004, 85-90.
https://doi.org/10.1016/b0-12-145160-7/00017-x |
|
8. |
Caloz, R.; Collet, C. Remote sensing handbook: digital
processing of remote sensing images. Volume 3. Quebec, Canada, Presses de l'Université du Québec,
2001. |
|
9. |
Basommi P.; Guan, Q.; Cheng, D. Exploring land use and land
cover change in themining areas of Wa East district, Ghana using satellite
imagery. Open Geosci. 2015, 7(1), 618-626.
https://doi.org/10.1515/geo-2015-0058 |
|
10. |
FAO. Global Forest Resources Assessment Key
findings. Rome. |
|
11. |
Boisson, S.; Collignon, J.; Langunu, S.; Lebrun, J.; Ngoy, S.M.;
Mahy, G. Reconciling the phytostabilization of polluted soils with the
conservation of copper-cobalt flora in the Lubumbashi region: A strategy to
enhance extreme ecosystems? In: Peri-urban territories: development,
challenges and prospects in the countries of the South. 12 p, 2015. |
|
12. |
Sikuzani, Y.U.; Boisson, S.; Kaleba, S.C.; Khonde, C.N.;
Malaisse, F.; Halleux, J.M.; Bogaert, J.; Kankumbi, F. M. Land use
dynamics around mining sites along the urban-rural gradient of the city of
Lubumbashi, DR Congo. Biotech Agron. Soc. Environ. 2020, 24(1), 1-14. |
|
13. |
Shutcha, M.N.; Faucon, M.P.; Kamengwa, K.C.; Colinet, G.; Mahy,
G.; Ngongo, L.M.; Visser, M.; et Meerts, P. Three years of
phytostabilisation experiment of bare acidic soil extremely contaminated by
copper smelting using plant biodiversity of metal-rich soils in tropical
Africa (Katanga, DR Congo). Ecol. Eng. 2015, 82, 81-90.
https://doi.org/10.1016/j.ecoleng.2015.04.062 |
|
14. |
Vranken, I.; Amisi, Y.M.; Munyemba, K.F.; Bamba, I.;
Veroustraete, F.; Visser, M.; Bogaert, J. The spatial footprint of the
non-ferrous mining industry in Lubumbashi. Tropicultura. 2013, 31(1), 20-27. |

This work is licensed under the
Creative Commons Attribution
4.0
License (CC BY-NC 4.0).
Abstract
In the municipality of Cherif Lo,
the spatiotemporal evolution of phosphate quarries has resulted in mutations in
land use. This spatial growth is one of the factors in the dynamics of the
landscapes, leading to enormous environmental consequences in the study area.
The present study aimed to analyze the spatial changes around phosphate
quarries from 1973 to 2024. Using a remote sensing mapping approach coupled
with tools for collecting and processing field maintenance data, the
evolutionary trends in land use were quantified in the study area. The spread
of phosphate quarries in the Senegalese Company of Phosphates of Thies (SSPT) and Senegalese Phosphate Company (SEPHOS) is 796.87% and 0.18%,
respectively, between 1973 and 2024. This area also recorded a
rapid expansion of buildings (1825.08%), and orchards (1191.03%) over the study period followed by a
regression of other crop areas (-58.06%) and vegetation (-12.20%). These
negative effects are much more pronounced near mining sites. These
disturbances, linked to the evolution of phosphate quarries, were amplified
over time and were perceptible within all classes of distance from mining
sites.
Abstract Keywords
Spatiotemporal dynamics, phosphate quarries, environmental consequences, Senegal.
This work is licensed under the
Creative Commons Attribution
4.0
License (CC BY-NC 4.0).
Editor-in-Chief


This work is licensed under the
Creative Commons Attribution 4.0
License.(CC BY-NC 4.0).